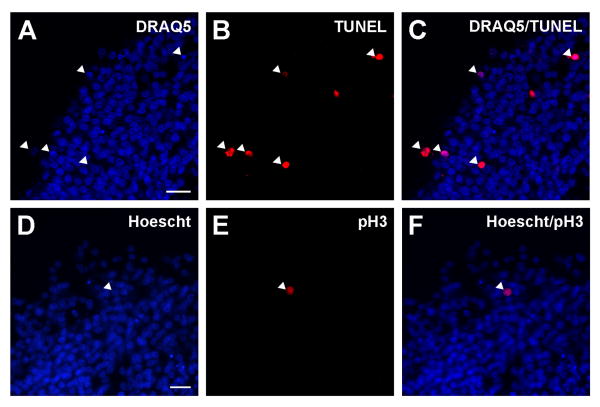
Figure 1.
Representative example of TUNEL and pH3 staining on cryosections of SAG explants in collagen gels.
Upper and lower panels show TUNEL labeling and pH3 immunohistochemistry, respectively. Confocal images of sections labeled with DRAQ5 (A) and TUNEL (B). Images of DRAQ5 and TUNEL staining merged for cell death quantification (C). Far-red DRAQ5 images were false-colored as blue. The percentage of TUNEL-positive neurons was calculated by dividing the number of DRAQ5/TUNEL double-positive cells (arrowheads in C) by the total number of DRAQ5 cells. Images of Hoescht counter-staining (D) and pH3 immunostaining (E). Images of Hoescht and pH3 staining merged (F). The percentage of proliferating cells was calculated by dividing the number of pH3/Hoescht double-positive cells (arrowhead in C) by the total number of Hoescht-labeled cells.

