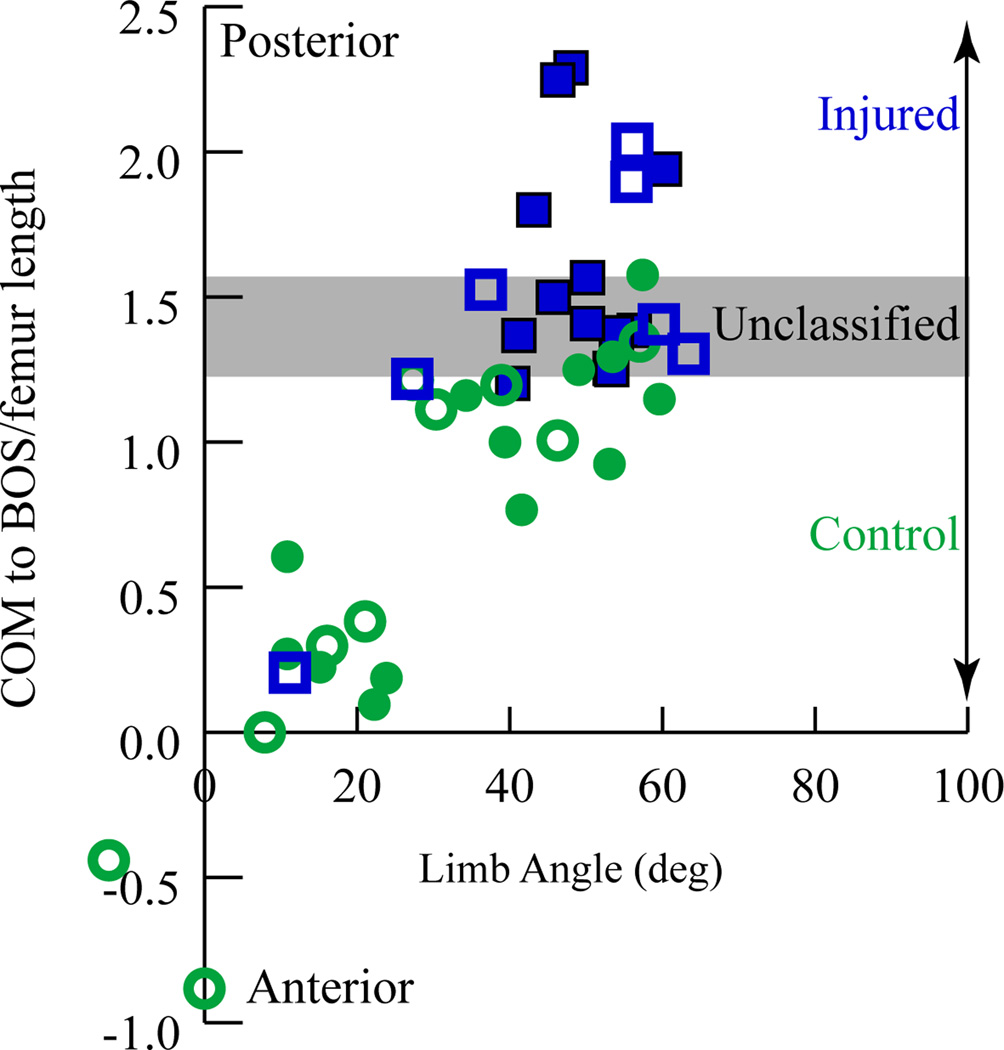
Figure 6. Discriminant Analysis.
COM_BOS plotted versus limbG angle. The data from athletes who sustained an ACL-injury are represented by blue squares. The subjects in the control group are represented by green circles. Hollow symbols represent male subjects and filled symbols represent female subjects. The discriminant analysis determined that COM_BOS could predict membership in a group to within 80% accuracy (1 injured case and 7 control cases were misclassified). Neither the limbG nor the trunkG angle could discriminate to the same level.

