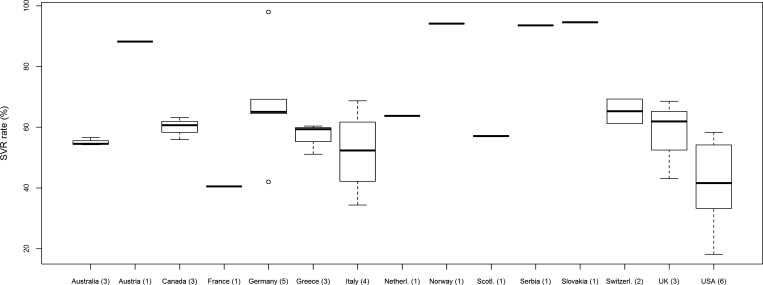
Figure 3.
Box plot illustrating sustained virologic response (SVR) rates by country of origin and includes all studies analyzed as part of meta-analysis as well as 4 outliers from Slovakia, Germany, Norway, and Serbia. The numbers in parentheses are the number of studies from each location. The SVR rate reported in US studies is significantly lower in comparison with other countries (P = .035). The box extends from the 25th to the 75th percentile. The line in the middle of the box is the median and the lines extending from either end of the box indicate the extent of the data beyond the 25th and 75th percentiles, and outliers, if any. Abbreviation: SVR, sustained virologic response.

