
Fig. 2.
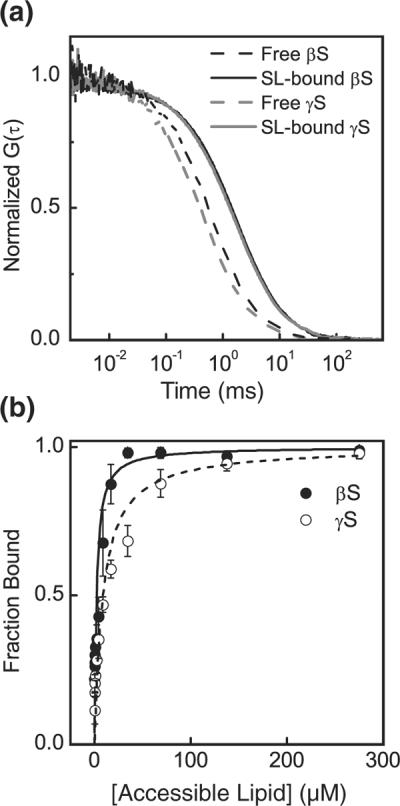
(a) Normalized FCS curves indicating binding of βS and γS to small liposomes (SL) made of 50:50 POPC: POPS. Free βS, black broken line; SL-bound βS, black continuous line; free γS, gray broken line; SL-bound γS, gray continuous line. (b) By fitting the autocorrelation curves with Eq. (1), we can calculate the fraction of bound protein and construct the binding isotherm. βS (filled circles); γS (open circles). Lines are fits to Eq. (3).