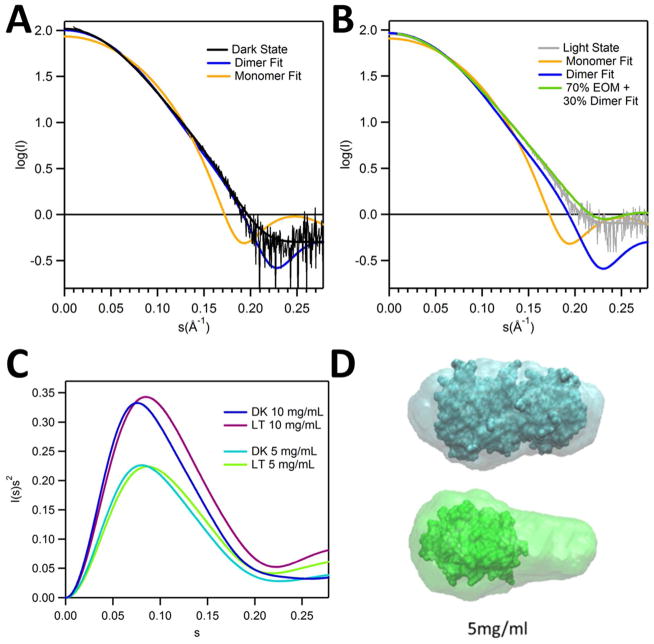
Figure 9.
SAXS of RsLOV in dark and light states. (A) Fits of scaled theoretical monomer (orange) and dimer (blue) scattering curves generated with CRYSOL for the dark (black) and (B) light (gray) state RsLOV (5 mg/mL data). EOM fits generated with RANCH13/GAJOE13 of the monomer were generated from the truncated pdb file of the dimer with only the A subunit. Light state fit composed of 70% EOM monomer model and 30% dimer (lime). (C) Kratky plot of dark and light state RsLOV data of 10 and 5 mg/mL samples. (D) Scattering envelope models based on the 5 mg/mL SAXS data of dark state RsLOV (top, cyan) and light state RsLOV (bottom: green), superimposed with the crystal structure surface of RsLOV, as a complete dimer or truncated to a monomer.

