
Figure 4.
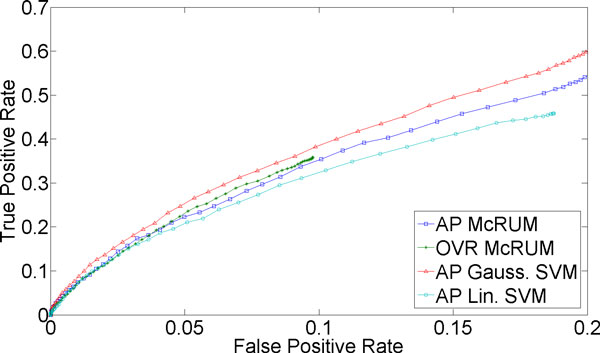
Evaluation results on independent test set for miRNA being the positive class. The ROC curves are generated from observed FPR and TPR under varying posterior probability thresholds from 0.30 to 0.99 in increments of 0.01 for the two McRUM models (AP and OVR settings) with the Naïve decoding algorithm, and for the Gaussian and linear SVMs with all-pairs decomposition.