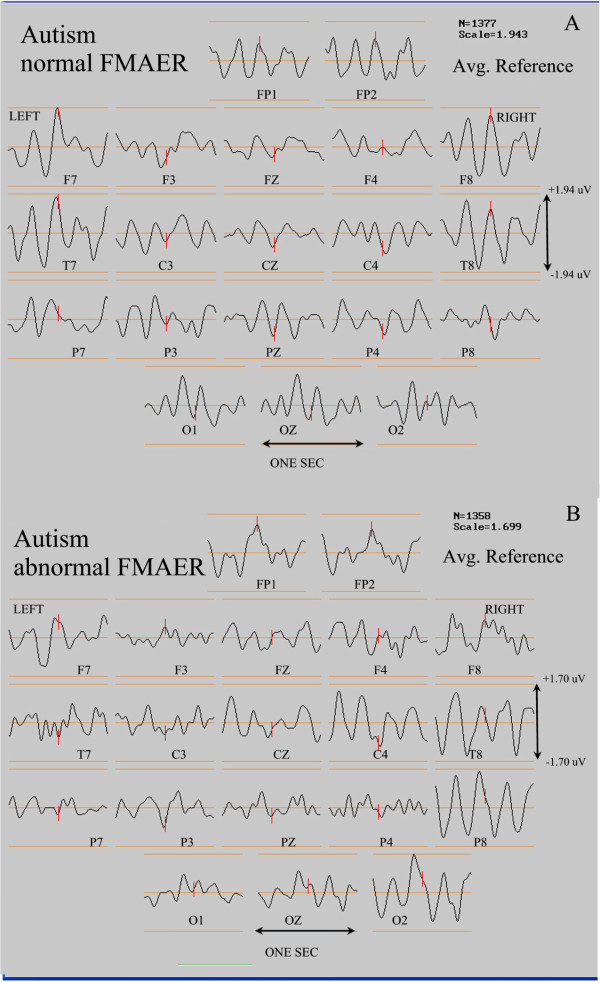
Figure 15.
Normal and abnormal FMAERs in autism. The display convention is as for Figure 12. In the current figure, the top pane (A) illustrates a normal FMAER in a patient with autism. The bottom pane (B) shows an abnormal FMAER that is absent in the left temporal region of another patient with the same diagnosis of autism (see text for discussion).

