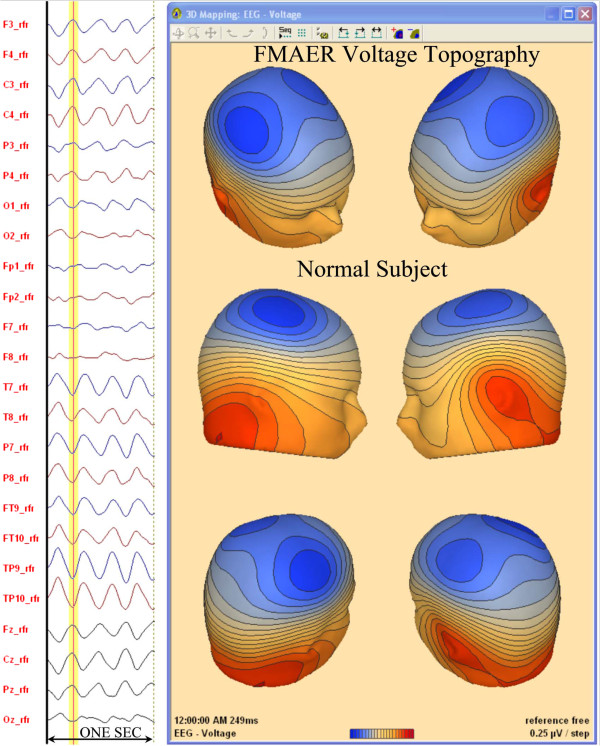
Figure 3.
128 Channel mapping of normal FMAER, common average reference. The same data from the same 7 year old normal subject, shown in Figure 2, are now depicted when utilizing 128 channels (24 selected waveforms as shown to the left) with utilization of the “reference free” technique, which is quite similar to the common average reference approach (Figure 1B). The waveforms to the left are one second in length. In the 3D head maps depicted to the right, the FMAER shows a topographic distribution suggestive of two dipoles, one over each hemisphere with negative (blue) end over the central region and positive (red) end in the mid temporal region and below. The spatial topography suggests the source may be between these two scalp maxima, likely in the temporal lobes.

