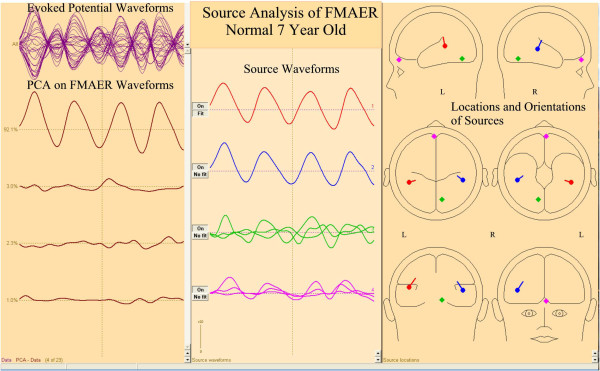
Figure 4.
Source analysis of a normal subject’s FMAER. Source analysis is illustrated for the same 7 year old whose scalp data are shown in Figures 2 and 3. The time base is approximately one second for all waveforms. The top of the left pane shows all channel data overlain; below this a principal components analysis (PCA) illustrates a single, prominent, primary factor showing the expected 4 Hz sine wave. Source analysis (Hagenmuller at al. [23]) shows two major sources whose source waveforms are shown in the center pane and whose source locations and orientations are displayed in three dimensions within the right pane. Final two sources explain residual noise (Hagenmuller at al. [23]). Source waveforms and source locations are correspondingly color coded. See also Figure 5.

