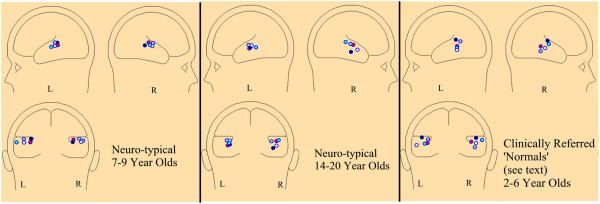
Figure 6.
FMAER source locations for 15 subjects. The three panes each show three schematic head maps seen from the left, right, and posterior views. Each pane illustrates the locations of primary left and right temporal sources for the indicated groups. The colored dots remain color specific for a single subject, e.g., within each pane the red dots reflect data from the same individual subject. Each subject’s FMAER data were source analyzed, displayed in an age appropriate normalized MRI, and the results graphically transferred to the schematic head maps shown. Source location is shown without source orientation.

