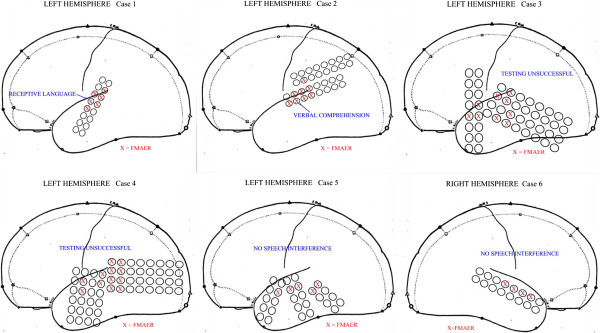
Figure 7.
Cortically recorded FMAER for six subjects. Five images represent a schematic representation of the left hemisphere (Cases 1–5) and one the right hemisphere (Case 6). Atop the hemisphere images are placed representations of one or more grids, i.e. electrode contacts embedded within a thin plastic strip. Electrode centers are 1 cm apart and are used for recording EEG activity during invasive, inpatient recording and may also be utilized for FMAER recording as well as for invasive electrical stimulation to detect and localized eloquent language cortex prior to epilepsy surgery. The red crosses represent contacts where the FMAER was readily detected. For cases where cortical stimulation was undertaken, results are summarized as shown in blue font text. Note the temporal location of the FMAER responses. Cases 1 and 2 demonstrated language interference upon cortical stimulation as shown in blue text. Cases 3–6 showed no response to cortical stimulation.

