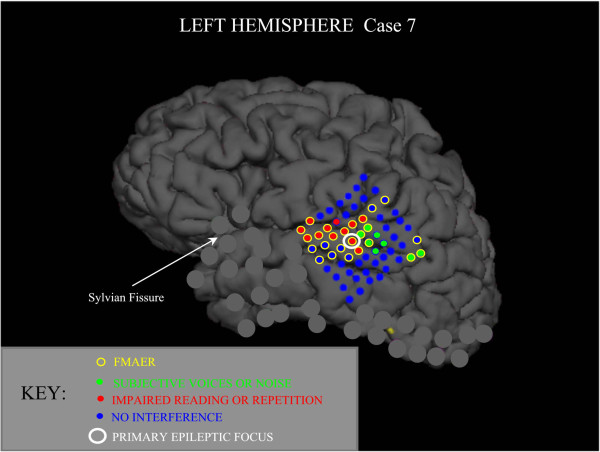
Figure 8.
Cortically recorded FMAER; high electrode density grid, one subject. The true lateral surface and grid contact locations are shown as reconstructed from MRI and CT studies. The superior surface (vertex) is shown above, inferior temporal surface below, prefrontal lobe to left and occipital pole to right. An 8 × 8 (64 contact) high density grid is shown as placed over the left temporal region where contact centers are 0.5 cm apart. The FMAER was recorded from electrodes surrounded by yellow circles. Red dots signify contacts exhibiting impairment of reading and/or of speech repetition during cortical stimulation. The green dots are regions where the patient reported hearing voices or noise. The single contact showing the primary epileptic focus is surrounded by a larger white circle. Blue dots represent contacts not found to interfere with language function during cortical stimulation. Contacts of additional standard grids placed elsewhere are grayed out to avoid image clutter. None of these grayed out standard grid contacts demonstrated FMAER responses.

