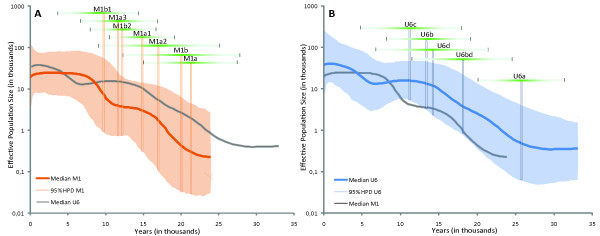
Figure 3.

Bayesian Skyline Plot for Haplogroups M1 and U6. The BSPs show the variation of the Effective Population Size (Ne) through Time for M1 (Figure 3a) and U6 (Figure 3b) based on the full mitochondrial genomes. The axis scales are identical for both plots. For comparison, the median of the second haplogroup is shown in grey, but not the 95% HPD. Overlaid on the plots are the coalescent ages of some relevant sub-haplogroups, with the vertical bars indicating the calculated coalescent ages (using the calculator from [34]) and the horizontal ones their 95% confidence interval.
