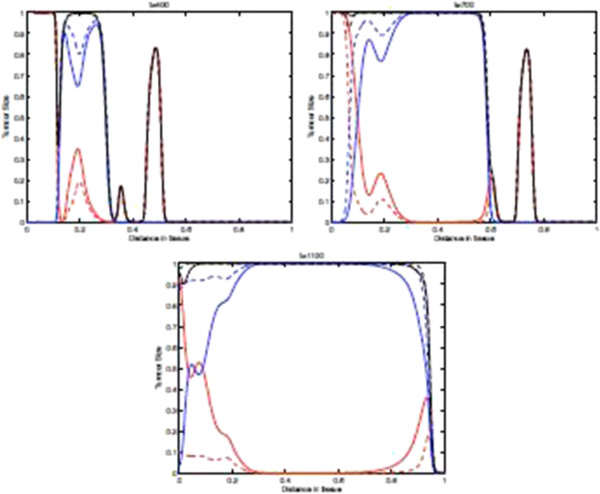
Figure 15.

Tumour cell density within the tissue in for decreasing and pi. Plots showing the distribution of tumour cell density within the tissue at times corresponding to 400, 700, and 1100 days respectively. These plots illustrate the spatiotemporal onset of immunoevasion. Parameter values pN=0.75 and are decreasing such that . Solid line with chemorepellent, dashed line without. The red lines represent the population T0, The blue lines represent the summed population T1 + … + TN, and the black lines represent the summed population T0 + … + TN.
