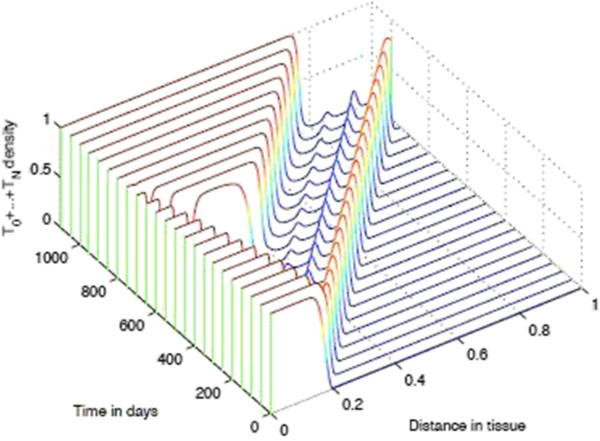
Figure 18.

Changes in the spatial distribution of all tumour cellswithin the tissue for decreasingpiand costant. Plots showing detailed changes in the spatial distribution of all tumour cells within the tissue over time in the case of immunoevasion. Parameter values pN=0.5 and .
