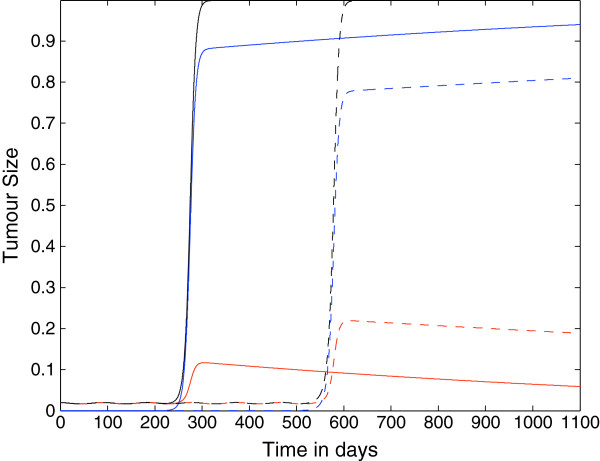
Figure 6.
Growth of the tumour cell population: nonspatial case 4. Plots showing the growth of the tumour cell population over time in the case where the spatial components of the model (i.e. all diffusion, taxis terms) have been set to zero. The plots show that the tumour can evade the immune system for either approximately 250 days or approximately 550 days depending on the parameter N. Parameter values: pN=0.75 and are linearly decreasing functions and: N=4 (solid line) and N=10 (dashed lines). The red lines represent the population T0, the blue lines represent the summed populations T1 + … + TN, and the black lines represent the summed populations T0 + … + TN. Time t is in days.

