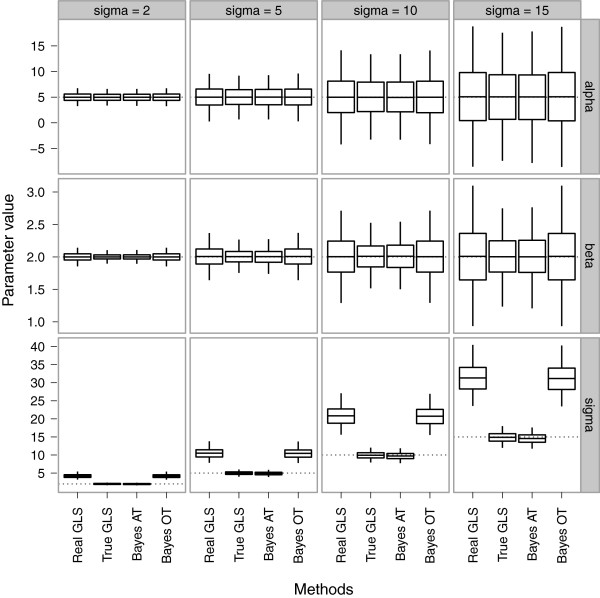
Figure 4.
Distribution of estimates for β 0 , β 1 and σ for simulated data based on 3,000 simulations. Simulated values for β0 and β1 are 5 and 2 (dotted lines). Simulated values for σ are 2, 5, 10 and 15 (dotted lines). Boxes represent 25% and 75% quantiles and the middle line represents the mean. Whiskers show 2.5% (bottom) and 97.5% (top) quantiles.

