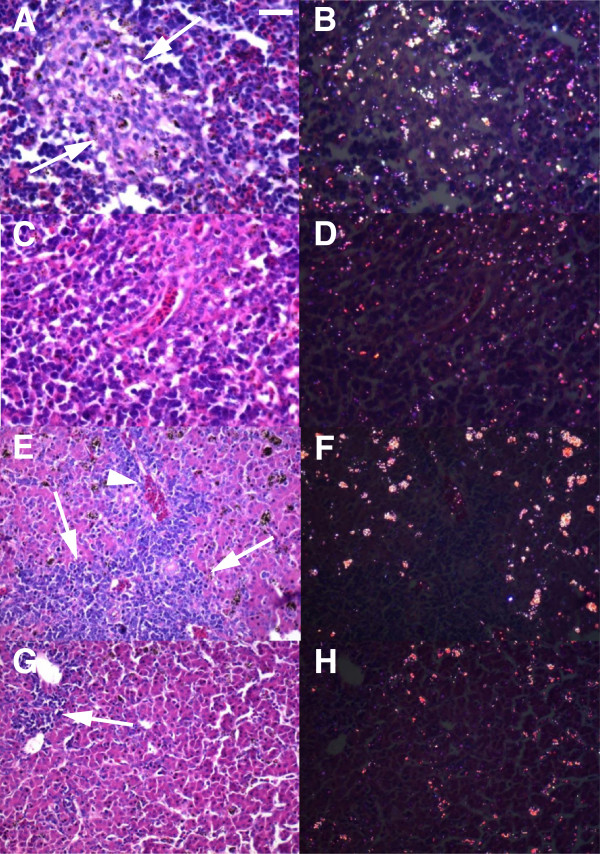
Figure 11.
Spleen and liver of aminoguanidine treated chickens have less malaria pigment during the acute phase of the infection. (A) Spleen section of untreated chickens stained with H&E, showing lymphocyte depletion (arrows). (B) Same visual field observed by polarized microscopy. (C) Spleen section of treated chickens stained with H&E, showing extensive lymphocyte depletion. (D) Same visual field observed by polarized microscopy. Note less birefringent material in treated chickens. (E) Liver section of untreated chickens, stained with H&E. An extensive area of inflammatory infiltrate can be seen (arrows) next to a vessel (arrowhead). (F) Same visual field observed by polarized microscopy. (G) Liver section stained with H&E of treated chickens. A predominantly mixed mononuclear inflammatory infiltrate can be observed (arrow). (H) Same visual field observed by polarized microscopy. Note less birefringent material in treated chickens. Bar = 50 μm.

