
Figure 10.
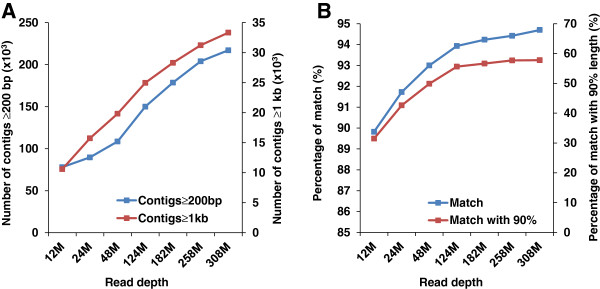
Evaluation of sequencing depth for the assembly of the catfish transcriptome assembly. (A) Assemblies were evaluated based on the number of assembled contigs with length ≥ 200 bp and 1 kb. The X-axis represents assemblies with various sequencing depths generated by CLC Genomics Workbench, left Y-axis represents the number of contigs with length ≥ 200 bp in thousand, and right Y-axis represents the number of contigs with length ≥ 1 kb in thousand. (B) Assemblies were evaluated based on the number of zebrafish proteins that were identified in the assembled catfish contigs. The X-axis represents assemblies with various sequencing depths assembled by CLC Genomics Workbench, left Y-axis represents the percentage of zebrafish proteins that can be detected in catfish and right Y-axis represents the percentage of zebrafish proteins that can be detected in catfish with match length ≥ 90%.