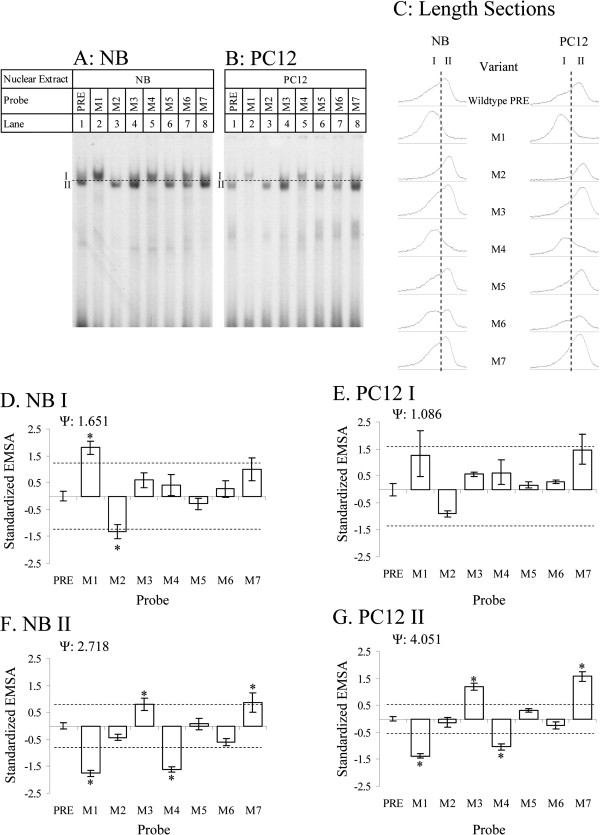
Figure 4.
EMSA of wildtype and mutant PRE oligomers and semiquantitative analysis of EMSA. Wildtype and mutant PRE oligomers (M1-M7) were incubated with A. NB and B. PC12 nuclear extracts were analyzed on non-denaturing PAGE. Samples were analyzed in triplicate; figure presents a representative gel for each. Bands “I” and “II” as described in the main text are indicated. Dashed line indicates division made between band I and band II for densitometry purposes. C. Cross section of EMSA lanes. ImageJ software was used to evaluate densitometry of scanned films from EMSA of NB and PC12 nuclear extracts with various PRE variant oligomer pairs. Profiles of peaks for each PRE variant from a typical gel are shown. Dashed line indicates boundary between band I and band II for densitometry purposes. D–G. Densitometry readings for EMSA films were normalized to standard deviations and average readings for “wildtype” signal within each film as described in the main text. Normalized readings were compared to the wildtype reading by Dunnett’s multiple t. Means significantly different at p > 0.05 indicated by “*”. D. Band I, NB extract. E. Band I, PC12 extract. F. Band II, NB extract. G. Band II, PC12 extract.

