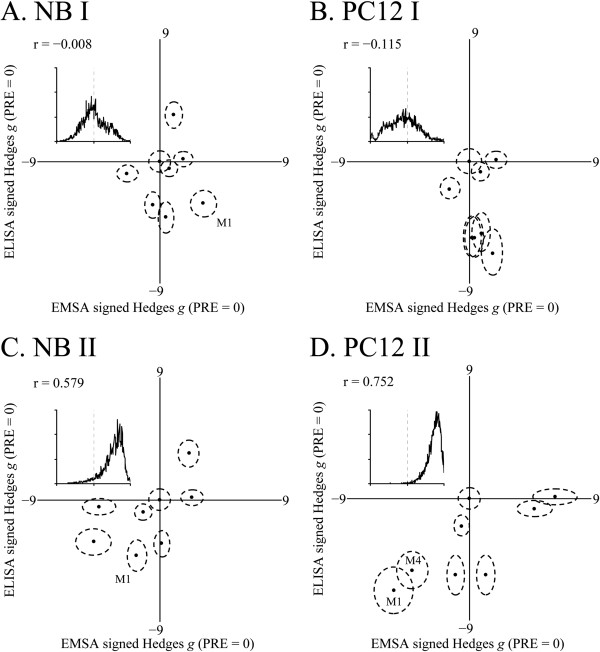
Figure 6.
EMSA vs. ELISA standardized effect sizes for PRE variants in NB and PC12 nuclear extracts and cultures. EMSA and ELISA results were used to generate Hedges pairwise g of comparisons of each mutant to wildtype PRE. Data was plotted with EMSA g on X axis and ELISA g on Y axis. Samples where both EMSA and ELISA signals were significantly different from wildtype at Bonferroni adjusted p < 0.05 are indicated with corresponding mutant names. Correlations were bootstrapped (repeats = 100000), and frequency distributions of correlation coefficients are presented as insets. A. EMSA Band I vs. ELISA in NB extract/cells. B. EMSA Band I vs. ELISA in PC12 extract/cells. C. EMSA Band II vs. ELISA in NB extract/cells. D. EMSA Band II vs. ELISA in PC12 extract/cells.

