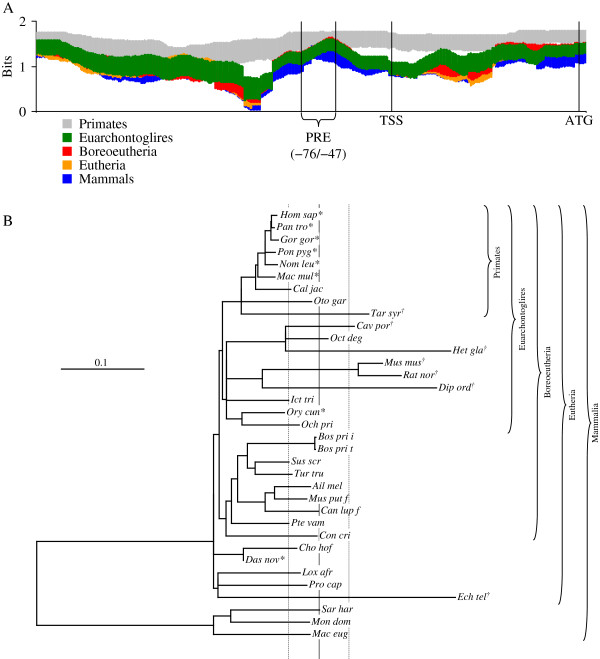
Figure 8.
Multiple sequence alignment of APP upstream regions and test of molecular clock. DNA sequences from 20 mammal species were downloaded from GenBank and aligned with WebPrank as described in the main text. A. Average information content in a window of 100 nt and 95% confidence intervals were calculated for primates, euarchontoglires, boreoeutheria, eutheria, and mammals. B. Alignment was used as input for parsimony/FITCH combined phylogeny estimation as described in the main text. This produced a bifurcating non-ultrametric tree, although some branch lengths = 0. The tree was artificially rooted between marsupials and eutheria, and root-to-tip distances for each species calculated. Root-to-tip distances were compared to mean root-to-tip distance for the entire tree. Individual distances that differed from the mean distance (vertical solid line) ± the 95% (Bonferroni adjusted for 35 comparisons) confidence interval (vertical dashed lines) were counted as “significant”. Distances that significantly exceeded the mean indicated by “†”. Differences significantly lower than the mean indicated by “*”.

