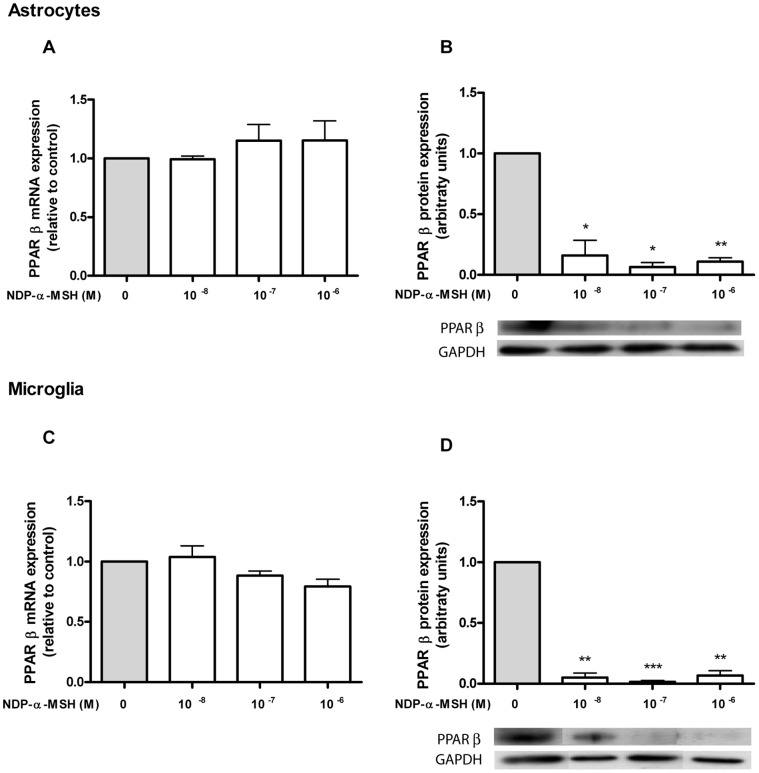
Figure 3. PPAR-β expression in rat astrocytes and microglia.
(A and C) Gene expression was studied by real time quantitative RT-PCR as described in Materials and Methods. No significant change in PPAR-β mRNA levels was detected after 24 h of incubation with NDP-α-MSH in both cell types. (B and D) Protein expression of PPAR-β was assessed by western blot after 24 h of treatment. NDP-α-MSH markedly decreased PPAR-β protein levels in both cell types. Data were analyzed by one sample t Test and are expressed as mean ± SEM. ***p<0.001, **p<0.01, *p<0.05 vs. control group.

