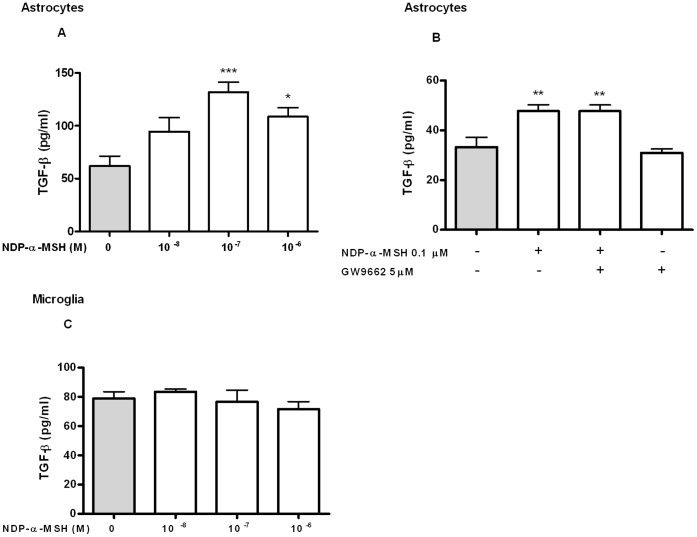
Figure 6. TGF-β release from rat astrocytes.
TGF-β levels in culture supernatants were quantified by ELISA after 6 h of treatment. (A) NDP-α-MSH induced TGF-β release from astrocytes. (B) Treatment with 5 µM GW9662 had no effect on NDP-α-MSH-induced TGF-β release. (C) NDP-α-MSH had no effect on TGF-β release from microglia. Data were analyzed by one way ANOVA and are expressed as mean ± SEM. ***p<0.001, **p<0.01, *p<0.05 vs. control group.

