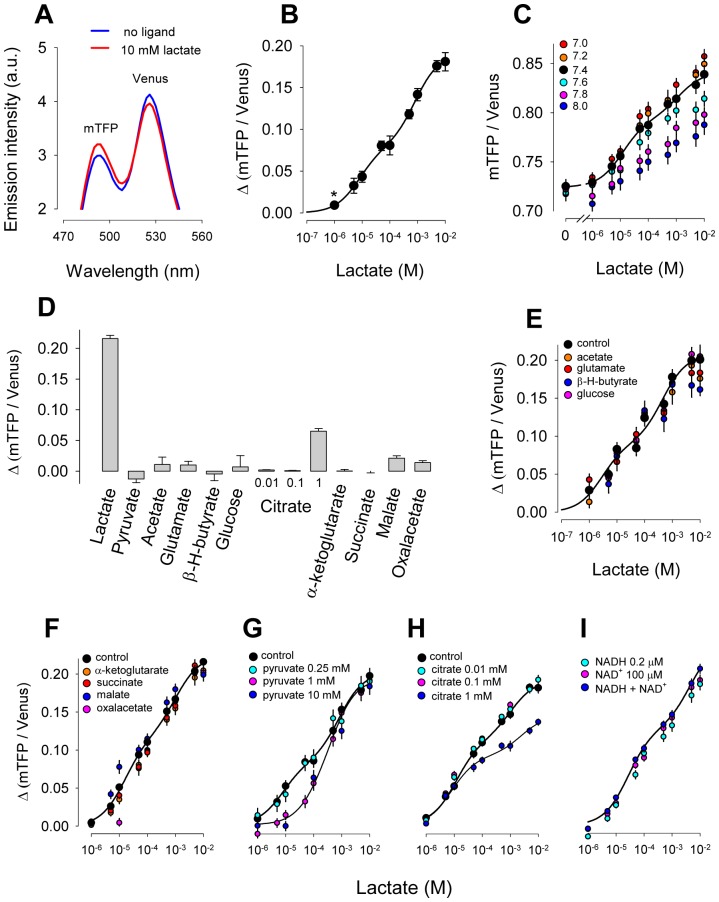
Figure 2. In vitro characterization of Laconic.
(A) Emission spectra in the absence and presence of 10 mM lactate. (B) The ratio between mTFP and Venus fluorescence (at 430 nm excitation) was measured at 0, 0.001, 0.005, 0.01, 0.05, 0.1, 0.5, 1, 5 and 10 mM lactate. The continuous line corresponds to the best fit of a double rectangular hyperbola to the data, with apparent dissociation constant (KD) values of 8 ± 2 µM and 830 ± 160 µM, and respective maximum ΔR values of 8 ± 0.4% and 11 ± 0.4%. (C) Lactate dose-response curves were measured at the indicated pH values. The continuous line corresponds to the best fit of a double rectangular hyperbola to the data at pH .4. (D) Response of the sensor to 5 mM of lactate, pyruvate, acetate, glutamate, β-hydroxy-butyrate and glucose, 1 mM of α-ketoglutarate, succinate, malate or oxalacetate, or increasing concentrations of citrate (0.01, 0.1 and 1 mM). In panels E to I, lactate dose-response curves were measured in the presence of 1 mM acetate, glutamate, β-hydroxy-butyrate or glucose (E), in 1 mM of α-ketoglutarate, succinate, malate or oxalacetate (F), in 0.25, 1 mM or 10 mM pyruvate (G), in 0.01, 0.1 mM or 1 mM citrate (H), and in 0.2 µM NADH, 100 µM NAD+, or 0.2 µM NADH plus 100 µM NAD+ (I). The continuous lines correspond to the best fit of a double rectangular hyperbola to control data.

