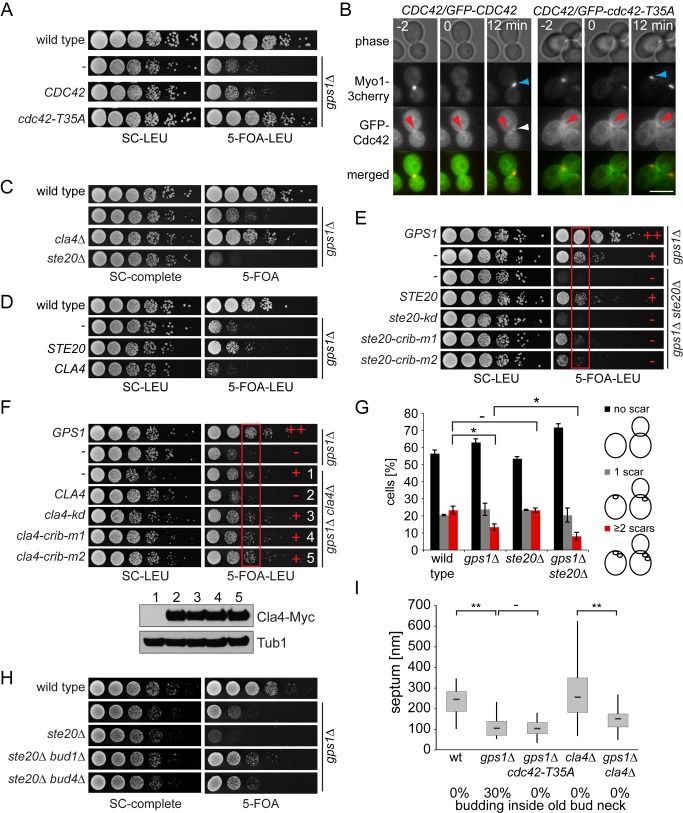
Figure 6. Gps1 regulates Cdc42.
(A) Growth effect of the cdc42-T35A mutant on gps1Δ cells. (B) Bud neck localization of Cdc42-T35A in comparison to wild-type Cdc42. Blue arrowhead, Myo1 polarization next to the old bud neck; white arrowhead, Cdc42 polarization next to the old bud neck; red arrowhead, bud neck localization of Cdc42 and Cdc42-T35A; Scale bar: 5 µm. (C) Genetic interaction of GPS1 with the Cdc42 effectors CLA4 and STE20. (D) Growth effect of STE20 and CLA4 overexpression (2 µ-based plasmid) on gps1Δ cells. (E) Genetic interaction between GPS1 and STE20 mutants expressed from the low-copy CEN plasmid. ste20-kd, Ste20 kinase dead; ste20-crib-m1 and ste20-crib-m2, Ste20 with inactive CRIB-domain. Normal growth (+) and growth sickness or lethality (−) are indicated. The red box depicts the cell culture dilution in which the growth difference between the indicated strains was most pronounced. (F) Genetic interaction between GPS1 and CLA4 expressed as in (E). The protein levels of Cla4-3Myc in the indicated strains (1–5) were analyzed by immunoblotting using anti-Myc antibodies. Tub1 served as a loading control. Red box as in (E). (G) Quantification of bud scars (n>100 per strain). Error bars show the standard deviation. (H) Genetic lethality of GPS1 with STE20 upon BUD1 or BUD4 deletion. (I) Quantification of septum thickness and “budding inside the bud neck” phenotype of wild-type (n = 34), gps1Δ (n = 47), gps1Δ cdc42-T35A (n = 39), cla4Δ (n = 33), and gps1Δ cla4Δ (n = 46) cells. “**” indicates p<0.0001; “*” indicates p<0.01; “−” indicates p>0.5. SC, synthetic complete medium.

