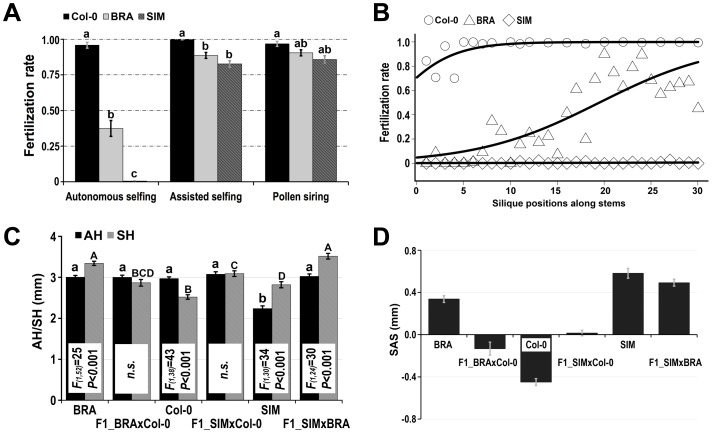
Figure 2. Characterization of approach herkogamy in the greenhouse.
(A) Means with standard errors (SEs) of fertilization rates in Col-0, BRA, and SIM – upon autonomous selfing, assisted selfing, and pollination of a male-sterile line (pollen siring). Letters above bars indicate significant differences (Tukey's post-hoc significance tests, α = 0.05) within each fertilizing group. (B) Self-fertilization rates in successive siliques along the main stems of Col-0, BRA, and SIM. The regression function is: y = exp(a+b*x)/(1+exp(a+b*x)). Coefficients (a/b) of non-linear models are 0.89/0.33, −2.98/0.15 and −5.97/0.035 for Col-0, BRA and SIM, respectively. (C) Measurements of anther height (AH) and stigma height (SH) in flowers of Col-0 (flowers N = 20), BRA (N = 27), and SIM (N = 16) and their hybrids (F1_BRAxCol-0, N = 16; F1_SIMxCol-0, N = 20; F1_SIMxBRA, N = 13). Significant differences (one-way ANOVA) between AH and SH within each genotype are indicated in the white boxes. Letters above bars indicate statistically significant differences (Tukey's post-hoc significance tests, α = 0.05) in AH or SH across all examined accessions. (D) Calculated SAS (SAS = SH – AH; means± SEs) of Col-0, BRA, SIM and their hybrids.

