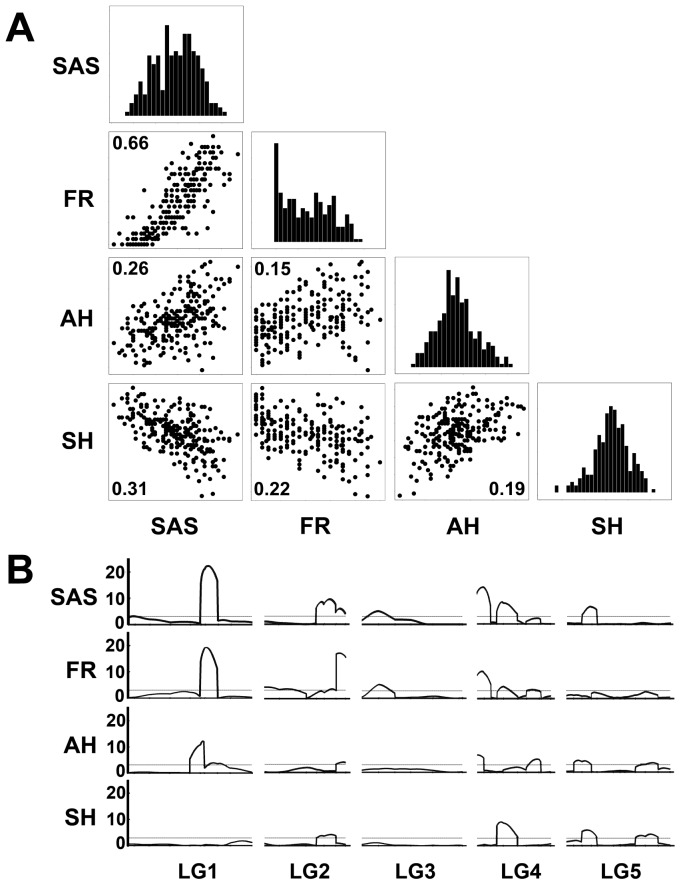
Figure 5. Quantitative trait locus (QTL) analysis of approach herkogamy.
(A) Distributions and correlations of untransformed phenotypic data of SAS (the proxy of herkogamy), self-fertilization rate (FR), anther height (AH), and stigma height (SH) in an F2 population derived from a cross between SIM and Col-0. The R2 values based on Pearson's correlation are shown in the plots (all P<0.001). (B) Alignment of logarithm of odds (LOD) maps for SAS, FR, AH, and SH. The dashed lines indicate the genome-wide significance threshold at LOD 3.0. LG, linkage group.

