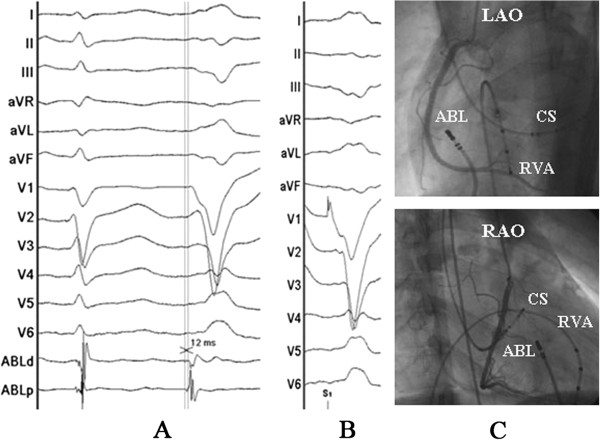
Figure 3.

Surface and intracardiac electrograms recordings, and fluoroscopic images obtained at the epicardial mapping site. (A) The local ventricular activation time recorded at the epicardial site that preceded the onset of the QRS complex was 12 ms. (B) Pace mapping at the same site. (C) Fluoroscopic images obtained in the left anterior oblique and right anterior oblique projection. Abbreviations as indicated in Figure 2.
