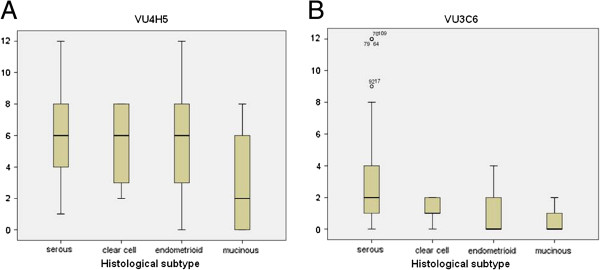
Figure 2.

MUC1 Expression within the different histological subtypes. Significant differences of expression were found for VU4H5 (A, p=0.008) and VU3C6 (B, p<0.001). The boxes represent the range between the 25th and 75th percentiles with a horizontal line at the median. The bars delineate the 5th and 95th percentiles.
