Figure 4.

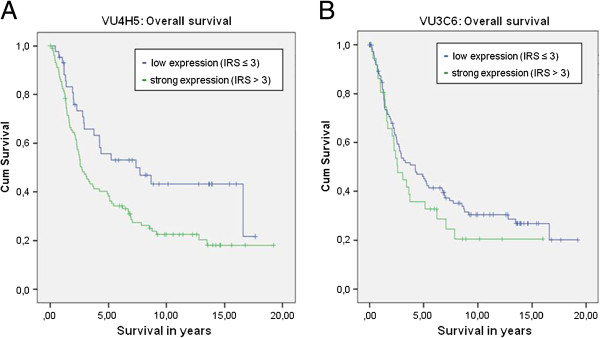
Overall survival for all patients of our study cohort. Kaplan-Meyer curves showing overall survival. Results for VU4H5 showed significant differences (p= 0.011, A), but VU3C6 did not (p=0.262, B).

Overall survival for all patients of our study cohort. Kaplan-Meyer curves showing overall survival. Results for VU4H5 showed significant differences (p= 0.011, A), but VU3C6 did not (p=0.262, B).