
Figure 4. Subcellular localization of AtGnTL-mCherry in plasmolysed and non-plasmolysed tissues of N. benthamiana.
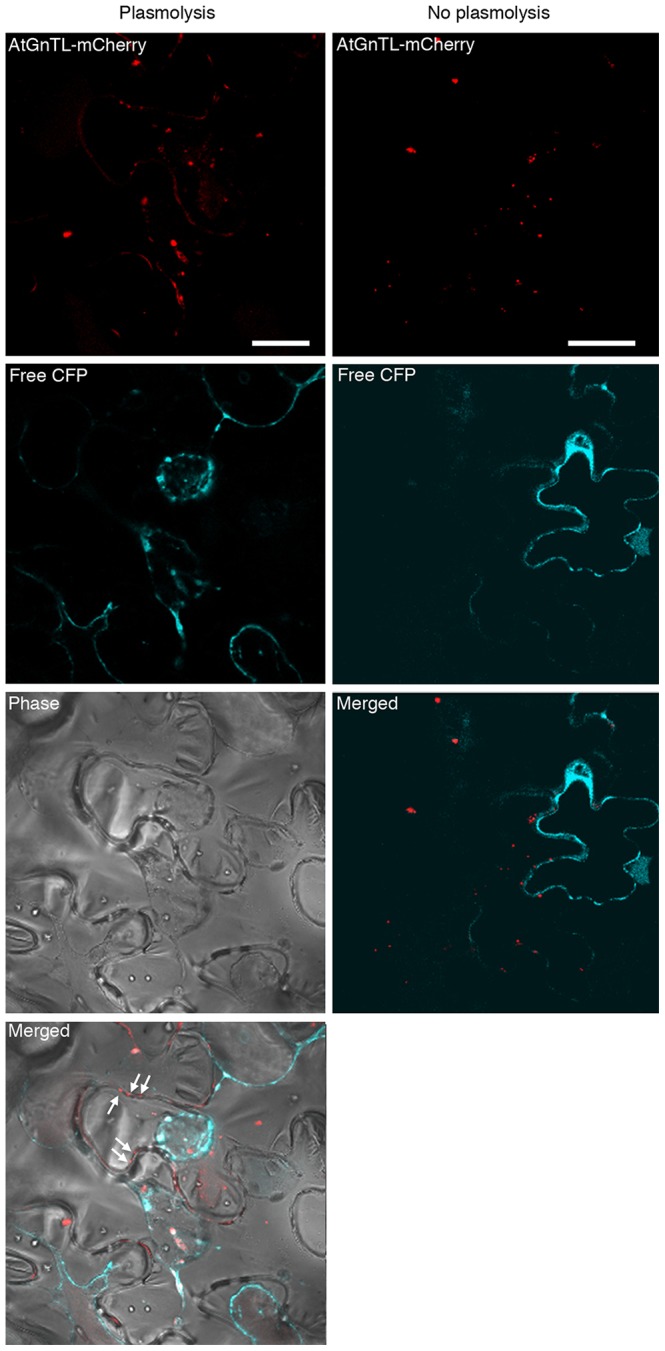
mCherry fluorescence is in red, CFP fluorescence is in blue; plastid autofluorescence was filtered out. Punctate mCherry fluorescence pattern at the periphery of the plasmolysed cells visible in the merged phase/fluorescence images is indicated by arrows. Note that, because, without plasmolysis, the CFP signal outlines the cells, we did not include the phase images of non-plasmolysed cells. Images are single confocal sections. Bar = 20 µm.