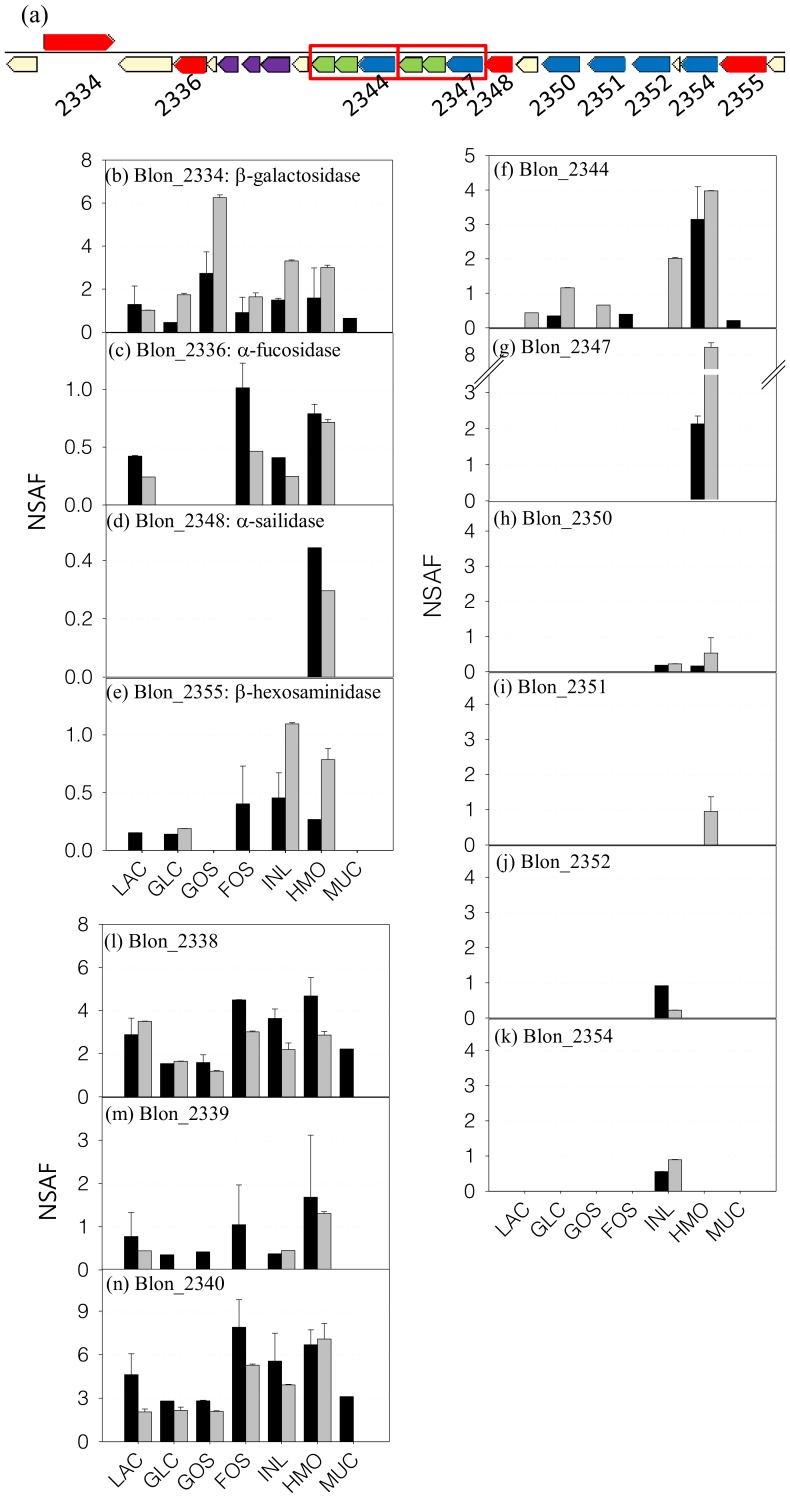
Figure 4. The expression of proteins in HMO cluster in B. infantis during growth on different prebiotics.
(a) Graphical display of genes in HMO cluster. Proteins involved in the HMO translocation and degradation are noted with the locus tag under the gene. Sets of genes inside the red box are the transport systems that comprise a Family 1 extracellular SBP and two inner-membrane components. Bars represent the relative amounts of each protein in different carbon sources. Black and gray bars indicate the NSAF values in the soluble and insoluble fraction, respectively. (b)∼(e) are the glycosyl hydrolases for HMO degradation. (f)∼(k) are the Family 1 SBPs and (l)∼(n) are the proteins whose the amount was high but the role in HMO metabolism is not well known.

