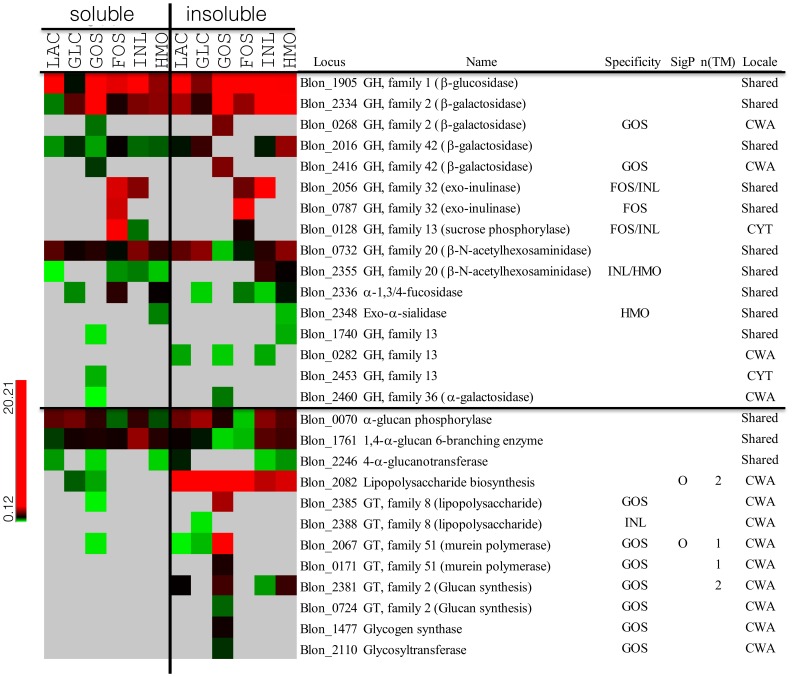
Figure 5. The expression of glycosyl hydrolases and glycosyltransferases in B. infantis during growth on different prebiotics.
The amount of protein expressed scaled by color from green to red as shown in the legend. Gray indicates that the expression was not detected. Left and right panel of heat map represent the expression of protein in soluble and insoluble fraction, respectively. CWA protein was determined by the NSAF ratio between soluble and insoluble faction (NSAFinsol/NSAFsol≥2.5).

