
Figure 2.
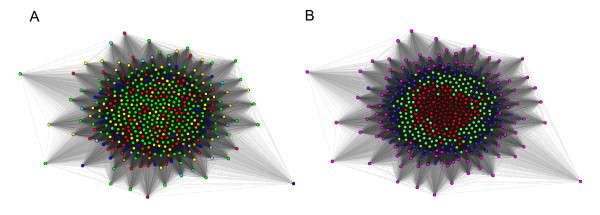
CLANS cluster map of randomly shuffled peptides from 437 organisms. Figure 2A is colored by taxonomic class and Figure 2B is colored by the number of peptides in an organism. Colors are similar to Figure 1.
Official websites use .gov
A
.gov website belongs to an official
government organization in the United States.
Secure .gov websites use HTTPS
A lock (
) or https:// means you've safely
connected to the .gov website. Share sensitive
information only on official, secure websites.
CLANS cluster map of randomly shuffled peptides from 437 organisms. Figure 2A is colored by taxonomic class and Figure 2B is colored by the number of peptides in an organism. Colors are similar to Figure 1.