
Figure 3.
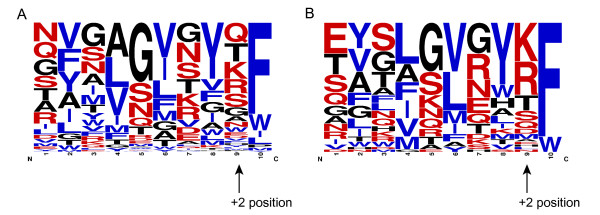
Frequency plots derived from unique C-terminal insertion signal peptides for Escherichia (Figure 3A) and Neisseria (Figure 3B) strains. Frequency plots were made from 188 unique peptides of 31 Escherichia strains and 50 unique peptides of 7 Neisseria strains. The +2 position is indicated by the arrow in the figure. Escherichia strains (Figure 3A) have no strong preference for any amino acid at the +2 position, whereas Neisseria strains (Figure 3B) have a strong preference for positively charged amino acids (Arg and Lys) at the +2 position. Hydrophobic residues are colored in blue and polar residues are colored in red.