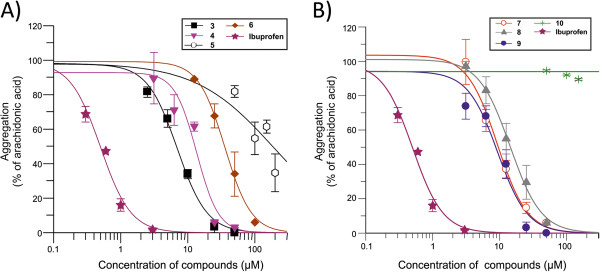
Figure 3.

IC50 fitting curves for inhibitory compounds and ibuprofen on platelet aggregation. Slopes of aggregation curves were analyzed by Grafit 7 software and inhibition curves were obtained. (A) represents compounds of type I and (B) compounds of type II. Ibuprofen inhibitory curve is represented on each plot. Results correspond to mean ± S.E.M. for 3–5 experiments.
