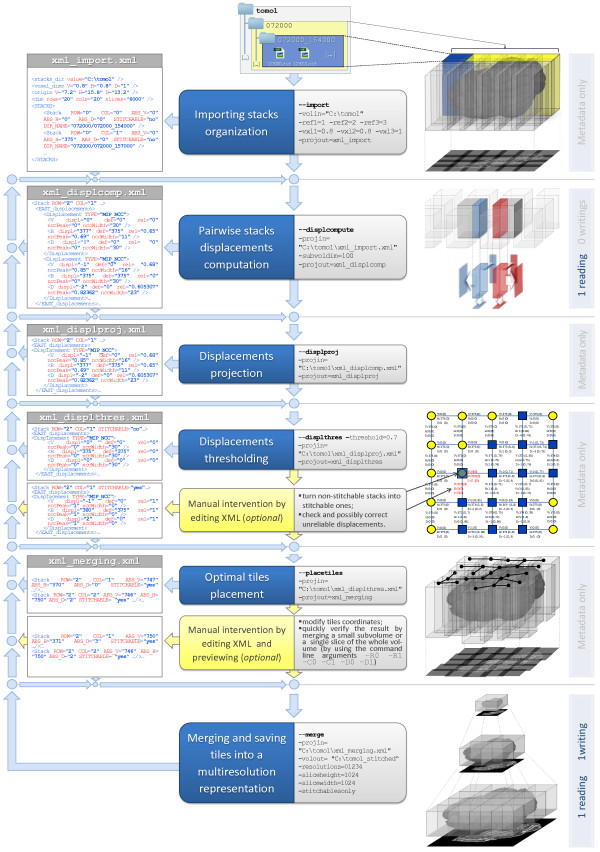
Figure 1.
The stitching pipeline. The central column lists both automatic and optional manual steps that compose the pipeline. For each automatic step are shown alongside the corresponding command line arguments as well as their values used in a sample workflow. The left column shows the metadata flow and the most significant portions of XML files for each step. On the right column there are some figures illustrating the elaboration of both data and metadata and the number of data readings and writings. The figure which illustrates the manual refinement after the Displacements thresholding step was obtained by using the MATLAB scripts we provide for a more comprehensive analysis of metadata. Stitchable stacks are marked in blue (dark grey) and non stitchable ones are marked in yellow (light grey).

