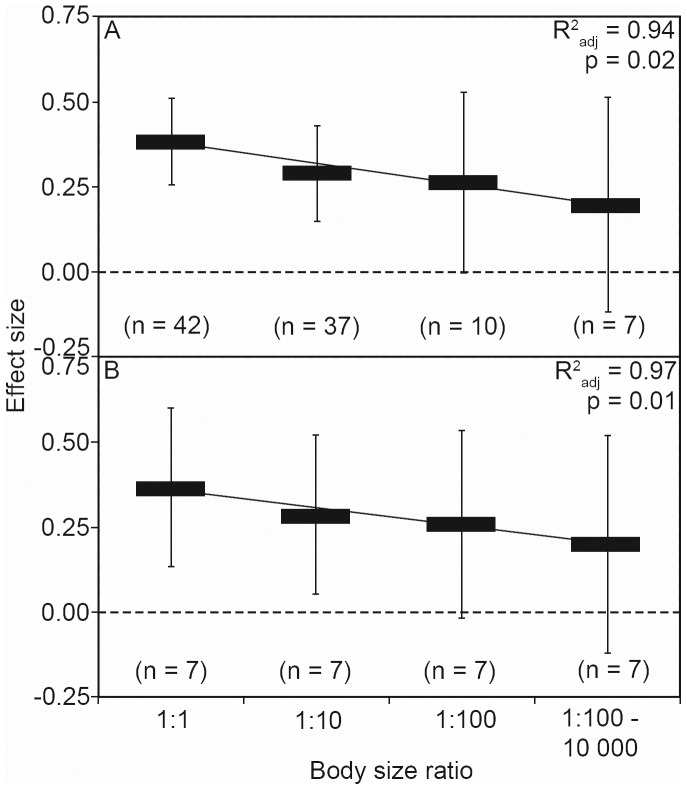
Figure 2. Regression analysis quantifying the relationship between the effect size for cross-taxon congruence and the ratio of body sizes of the groups being compared.
The effect sizes, with associated 95% confidence intervals, for all studies found in the published literature is shown in (A) and the average effect sizes from the statistically-reduced and resampled analyses (to account for differences in sample size between body size ratios) in shown in (B). Effect sizes are significant where confidence intervals do not overlap zero.

