
Figure 1.
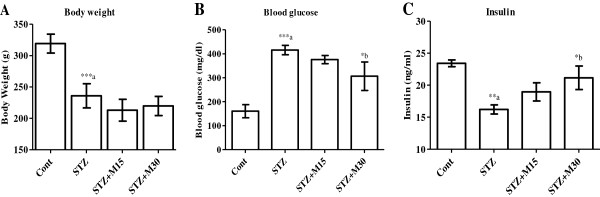
Effects of morin on (A) animals final body weight, (B) blood glucose and (C) insulin levels. Data were expressed as Mean±S.EM (n=6) and analyzed using one-way ANOVA followed by Student Newman-Keuls as post hoc test. ***a P<0.001 and **a P<0.01 Control vs STZ group; *b P<0.05 STZ vs. STZ+M15 or STZ+M30 groups.