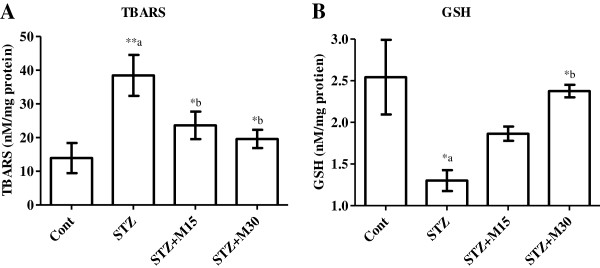
Figure 5.

Effects of morin on serum levels of (A) TBARS and (B) GSH in diabetic rats. Data were expressed as Mean±S.EM (n=6) and analyzed using one-way ANOVA followed by Student Newman-Keuls as post hoc test. *a P<0.05 and **a P<0.01 Control vs STZ group; *b P<0.05 STZ vs. STZ+M15 or STZ+M30 groups.
