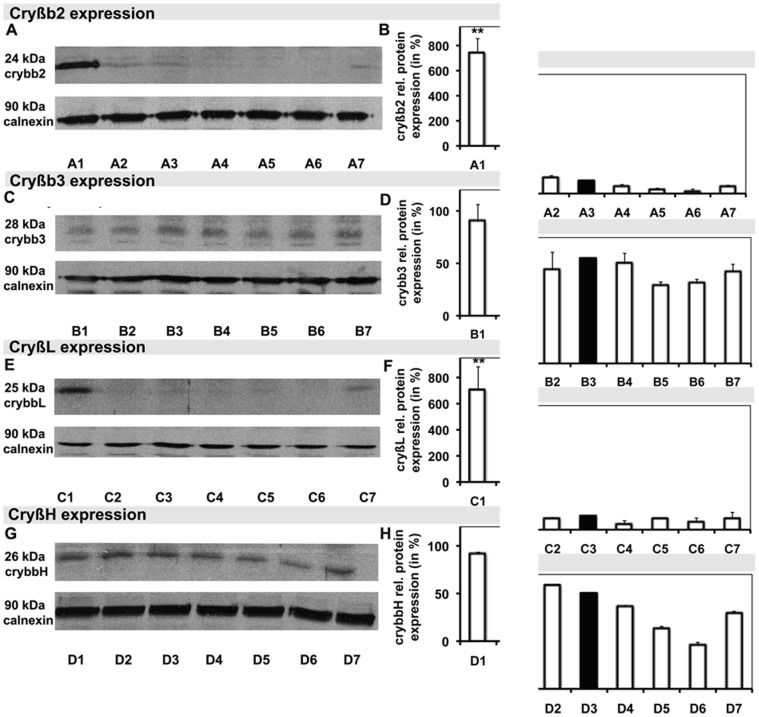
Figure 4. Specific Western blot analysis and the correlated graph of the relative density of selected proteins, including the application controls.
A–G Blots of cryβb2 (A) cryβb3 (C), cryβL (E), and cryβH (G), and their correlated relative densities (B, D, F, and H, respectively), each with the corresponding control with calnexin. Hypertensive samples are demonstrated in A1–D1, normotensive samples in A2–D2 and A3–D3, samples following Ti/B treatment in A4–D4, samples following Ti treatment in A5–D5, samples following Ti/Tr treatment in A6–D6, and samples following Ti/D treatment in A7–D7.

