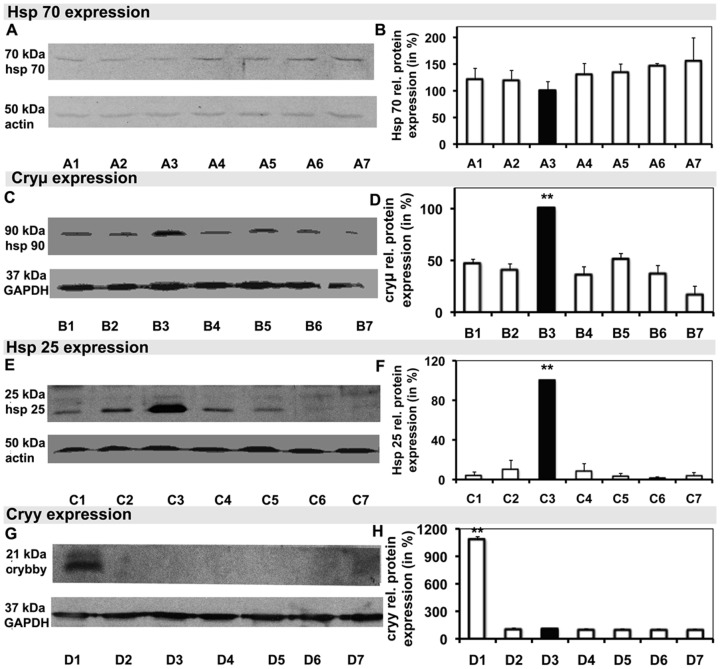
Figure 5. Specific Western blot analysis of selected proteins with the corresponding application controls.
The graphs next to them illustrate the relative protein densities. A–H Blots of heat-shock protein (HSP)-70 (A), HSP-90 (C), HSP-25 (E), and cryγ (G) and their relative densities (B, D, F, and H, respectively). Hypertensive samples are shown in A1–D1, normotensive samples in A2–D2 and A3–D3, samples following Ti/B treatment in A4–D4, samples following Ti therapy in A5–D5, samples following Ti/Tr treatment in A6–D6, and samples following Ti/D treatment in A7–D7.

