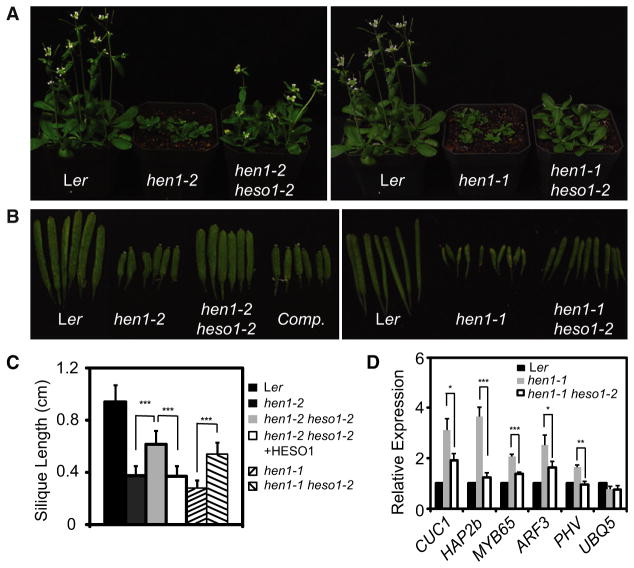
Figure 1. heso1-2 Mutation Partially Suppresses the Phenotypes of hen1-1 and hen1-2.
(A) Morphological phenotypes of the indicated genotypes.
(B) Siliques from plants of the indicated genotypes. Ler is WT plants. hen1-1 heso1-2 and hen1-2 heso1-2 are hen1-1 and hen1-2 harboring the heso1-2 mutation, respectively. Comp is hen1-2 heso1-2 harboring the HESO1 genomic DNA.
(C) Average silique length in various genotypes. Thirty siliques from six plants for each genotype were included in the analysis. ***p < 0.001.
(D) The transcript levels of miRNA and ta-siRNA targets in various genotypes. Target mRNA accumulation in various genotypes was quantified by qRT-PCR and compared with those of WT. Quantifications are normalized with ACTIN2 transcript. UBQ5: UBQUITIN5, which served as an internal control. The WT value is 1. *p < 0.05; **p <0.01; ***p < 0.001.

