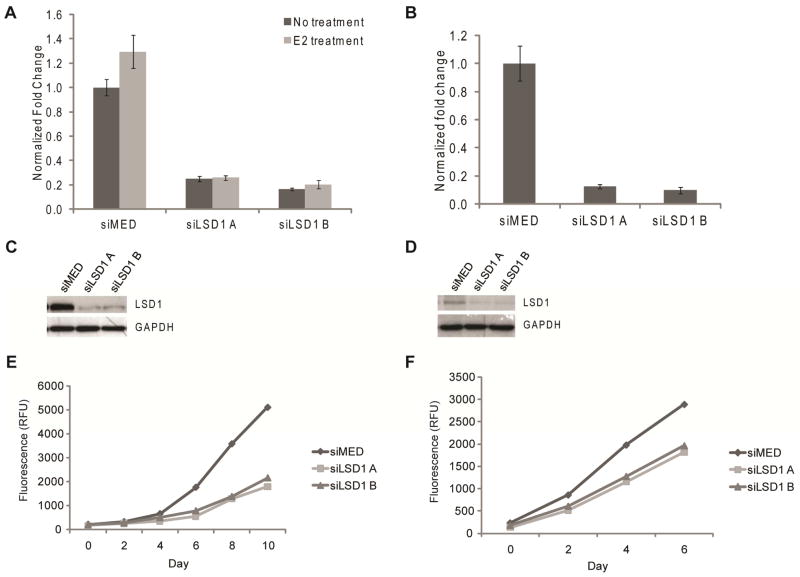
Figure 2.
Knockdown of LSD1 after transfection with either two unique siRNA duplexes to LSD1 (siLSD1 A and siLSD1 B) or siRNA control (siMED). A. mRNA levels measured after treatment for 18 h with either vehicle or 100 nM E2 in MCF7 cells. Data presented as ±SEM. B. mRNA levels measured in MDA-MB-231 cells. Data presented as ±SEM. C. LSD1 protein levels in MCF7 cells. D. LSD1 protein levels in MDA-MB-231 cells. E. MCF7 cell proliferation as measured by total DNA content after knockdown of LSD1. F. MDA-MB-231 cell proliferation as measured by total DNA content after knockdown of LSD1.

