
Figure 6. Comparison of structural landmarks in living and fixed tissue mounted on a Biopore membrane.
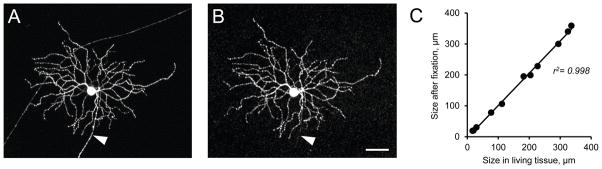
A and B. Confocal images of a representative RGC before and after fixation. Intrinsic fluorescence imaging in thy1-YFP mouse. No GFP antibodies were necessary to enhance the image following fixation. Axon is indicated by an arrowhead. Scale bar 50 mm. C. Correlation between RGC dendritic tree sizes and structural landmarks before and after fixation (n = 12 in 5 retinas).