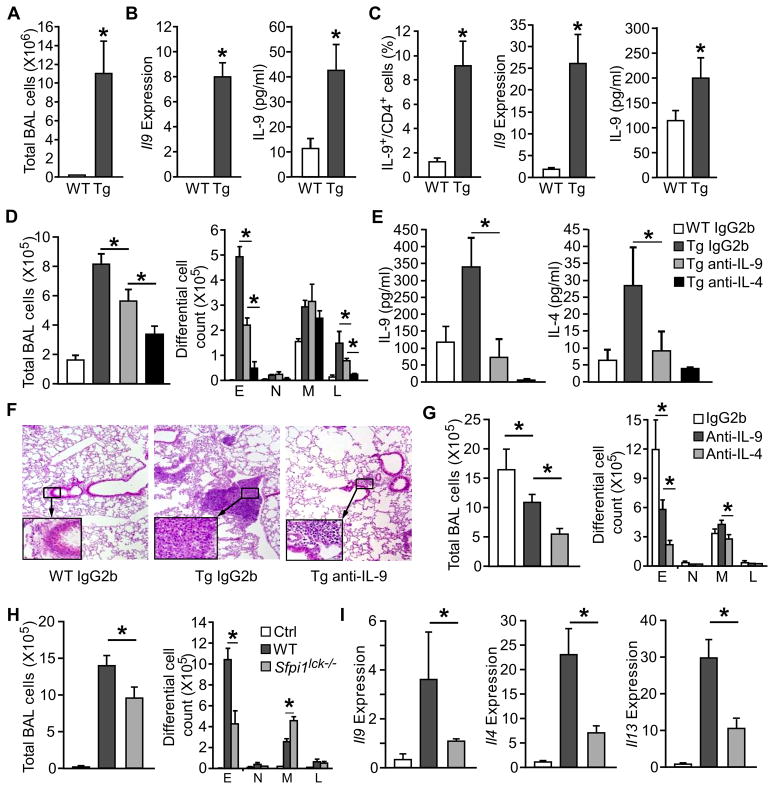
Figure 7. IL-9 is required for maximal TSLP-induced airway inflammation in TSLP-induced chronic and acute airway inflammation.
(A – C) BAL fluid, lung tissue, and lung-draining mediastinal lymph nodes were collected from 6 month old SPC-TSLP transgenic mice (Tg) and littermate controls (WT) and analyzed for, (A) cell number in the bronchoalveolar lavage (BAL) of transgenic and littermate control mice (B) Il9 gene expression in BAL cells and IL-9 present in the BAL fluid, and (C) IL-9 production by mDLN cells following stimulation with PMA/ionomycin (intracellular staining, left), or anti-CD3 stimulation (qPCR and ELISA, meddle and right).
(D – F) Neutralization of IL-9 in SPC-TSLP transgenic mice. Anti-IL-9 (10 μg/mouse), anti-IL-13 (10 μg/mouse), anti-IL-4 (50μg/mouse), or IgG2b isotype control (10 μg/mouse) were injected to SPC-TSLP and littermate control mice via tail vein twice a week for 4 weeks starting at 6 weeks of age. At 10 weeks of age, mice were analyzed for (D) total and differential cell counts in the BAL, (E) cytokine concentration in the BAL, and (F) lung histology by hematoxylin and eosin (H&E). WT, littermate controls; Tg: SPC-TSLP transgenic mice.
(G) Neutralization of IL-9 in TSLP-induced acute airway inflammation. BALB/c mice were treated intranasally every other day with 50 μg OVA and 500 ng TSLP for two weeks. Anti-IL-9 (10 μg/mouse), anti-IL-4 (50μg/mouse), or IgG2b isotype control were injected i.v. 30 min. before OVA+TSLP treatment. Total and differential cell counts in the BAL were analyzed 24 h after the last treatment.
(H – I) Role of Th9 cells in TSLP-induced acute airway inflammation. C57BL/6 and Sfpi1lck−/− mice were treated with OVA+TSLP as described in (G). Control group were C57BL/6 mice receiving OVA alone. 24 h after the last treatment, mice were analyzed for (H) total and differential cell counts in the BAL, and (I) cytokine gene expression in the lung by qPCR.
All data represent mean ± SEM (n=4–6 mice) and are representative of at least two separate experiments. *, p < 0.05.

