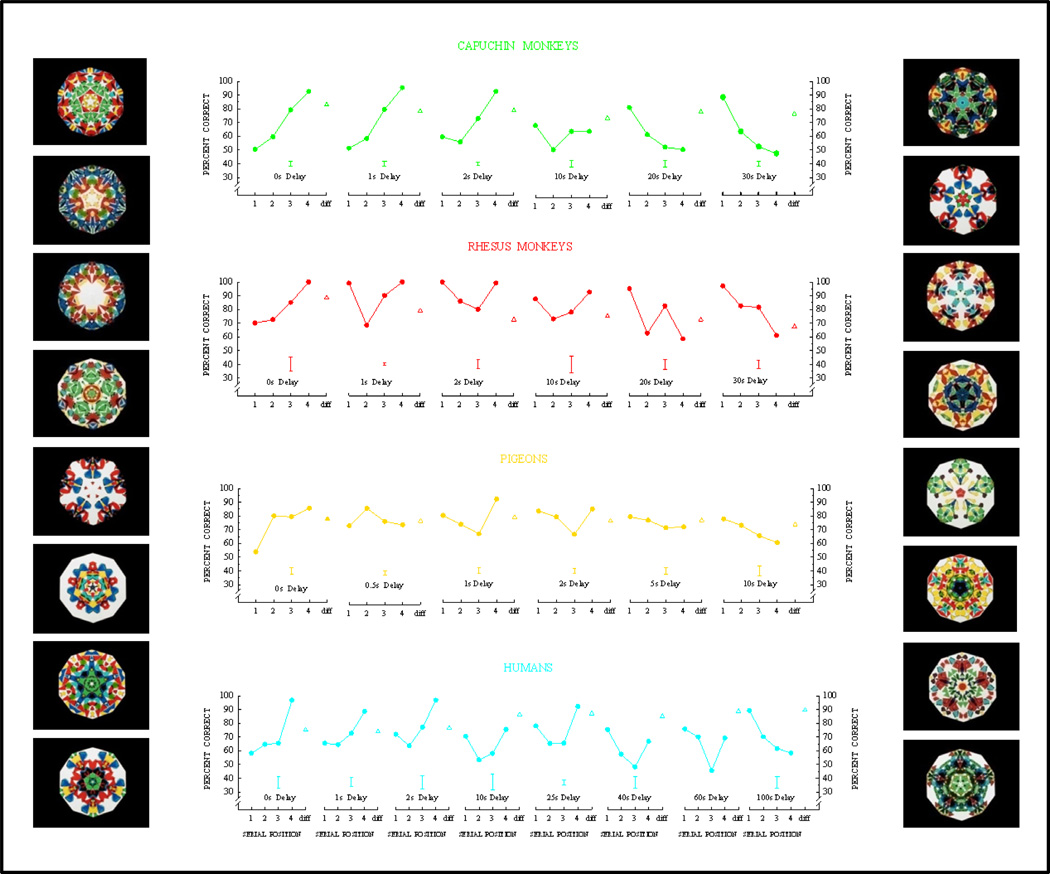
Figure 20.
Serial position functions showing primacy and recency effect changes as a function of retention delay for monkeys, pigeons, and humans. (The fourth item is the last list item.) Mean group error bars are shown below each serial position function. Different-trial performance is shown to the right of each serial position function. Animals were tested with “travel pictures” (Figure 19), and humans were tested with kaleidoscope patterns and kaleidoscope examples are shown on the sides of the figure.

