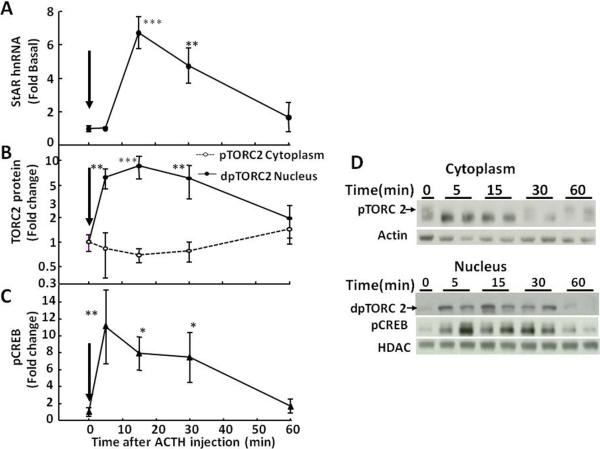
Fig 5.
Time-relationship between levels of StAR hnRNA (A), cytoplasmatic phospho-TORC2 (pTORC2,  ) and nuclear dephospho TORC2 (dpTORC2,
  ) protein (B), and nuclear phospho-CREB (pCREB) (C), in the adrenal zona fasciculata of rats subjected to ip injection of 5μg ACTH Rats were killed by decapitation at the time points indicated. Significant increases in nuclear dpTORC2 and pCREB preceded the increases in StAR hnRNA. Data points represent the mean and SE of the values in 4 rats per group; the arrows show the time of ACTH injection. *p<0.05; **p<0.01; ***p<0.001. D shows representative western blots for cytoplasmic pTORC2, nuclear dpTORC2 and pCREB. Beta actin and histone deacetylase (HDAC) were used as controls for cytoplasm and nuclear proteins, respectively.

