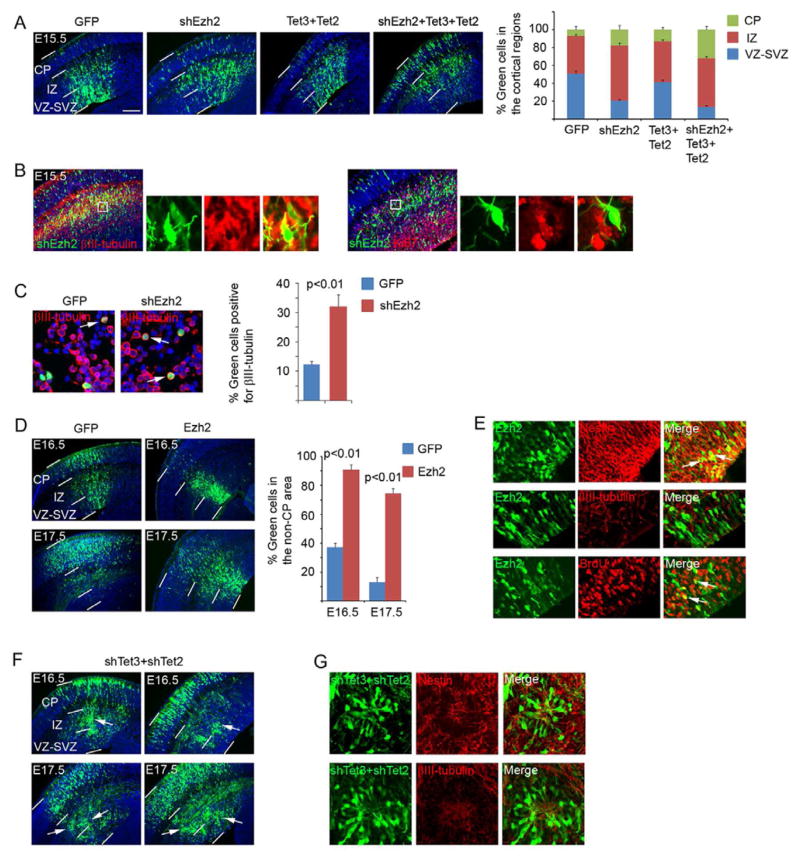
Figure 4. Functional analyses of Ezh2, Tet2 and Tet3 in the embryonic cortex.
A. DNA plasmids (shEzh2, Tet2 and Tet3 cDNAs; all carry an ubiquitin promoter-GFP expression cassette for visualization of the transfected cells) were introduced into the cortex at E13.5 via in utero electroporation. The brains were collected at E15.5 for analysis. Distributions (percentage) of transfected cells in different radial regions of the cortex were scored. Scale bar indicates 100 μm. CP, cortical plate; IZ, intermediate zone; VZ-SVZ, ventricular-subventricular zone.
B. Immunostaining of the brains electroporated with shEzh2 for βIII-tubulin or Ki67 expression.
C. Cortical cells derived from E15.5 brains (electroporated at E13.5) were plated on poly-D-lysine-coated coverslips for 2 hours, fixed, and stained for βIII-tubulin. Arrows indicate examples of positive cells. Percentage of βIII-tubulin positive green cells was scored.
D. Expression plasmids carrying Ezh2 cDNA were electroporated at E13.5 and the transfected brains were analyzed at E16.5 and E17.5. Percentage of cells remaining in the non-CP area (including the IZ and VZ) was scored.
E. Immunostaining of the brains electroporated with Ezh2 for nestin, β 3III-tubulin and incorporated BrdU with a 30 min pulse labeling.
F. shRNAs of Tet3 and Tet2 were co-electroporated at E13.5 and the transfected brains were analyzed at E16.5 and E17.5. White arrows indicate the clusters of cells in the cortex.
G. Immunostaining of the brains electroporated with shRNAs of Tet3 and Tet2 for nestin or βIII-tubulin.

